
A few years ago, most people including graduates saw going to college as the only pathway that leads to building a successful career and life. Nevertheless, in recent years that perspective began to shift, resulting in many graduates nowadays asking one pivotal question:
“Is college worth it and is it vital for building a successful career?”
While in the past the only questions torturing graduates’ minds were “which college is the best fit for me,” and “will I get accepted there?” Nowadays, these questions became simply follow-up questions as other equally fundamental questions took first place in the graduates’ minds.
Questions such as “is a private university worth the additional cost, or can I succeed with a community degree?” “what are some of the school statistics, national education statistics and education facts that speak about our education rate, the college experience, and its value in the society?” or “what do stats about education say regarding the advantages that college degree provides when it comes to seeking jobs and building a career/ earning more?” as well as the latest, immense questions like “how will the current epidemic influence the way college works?” and “what are the predictions for future college life as well as the job possibilities/opportunities in the post-epidemic world?” rose due to the current situation and contributed in toughening the decision making the process of graduates.
Seeing how much of an impact this decision can have on someone’s life, it is of utmost importance that graduates have all the facts, statistics, and predictions at their disposal when making this decision.
Guided by these thoughts, in this text we will be answering the previously mentioned questions through presenting a combination of education statistics, data, and experts’ predictions regarding college, all with the purpose of providing creditable, facts about education in America and checked information that will help students in analyzing and arranging their thoughts on this subject and making the right decision for their future based on valid USA education stats and data.
General Education Statistics – 2025
- In 2019, USA education stats show that 3.9 million Americans earned some type of college degree.
- Average millennials (25-34 years old) with bachelor’s degrees have 57% higher median earnings in comparison with those with just a high school degree.
- The demographics of students enrolling in PK-12 and those in college continue to change and vary; while white students are still predominant in enrolling in PK-12 with 23.7 million students, when it comes to colleges Asian students are predominant with 59%.
- According to Forbs, based on the criteria of public school education, Massachusetts is ranked the highest in quality and safety.
- A significant percentage of students (70% – 80%) are active in the work field while finishing their studies.
- Previous fall, 2019 approximately 18.2 million students enrolled in some sort of college.
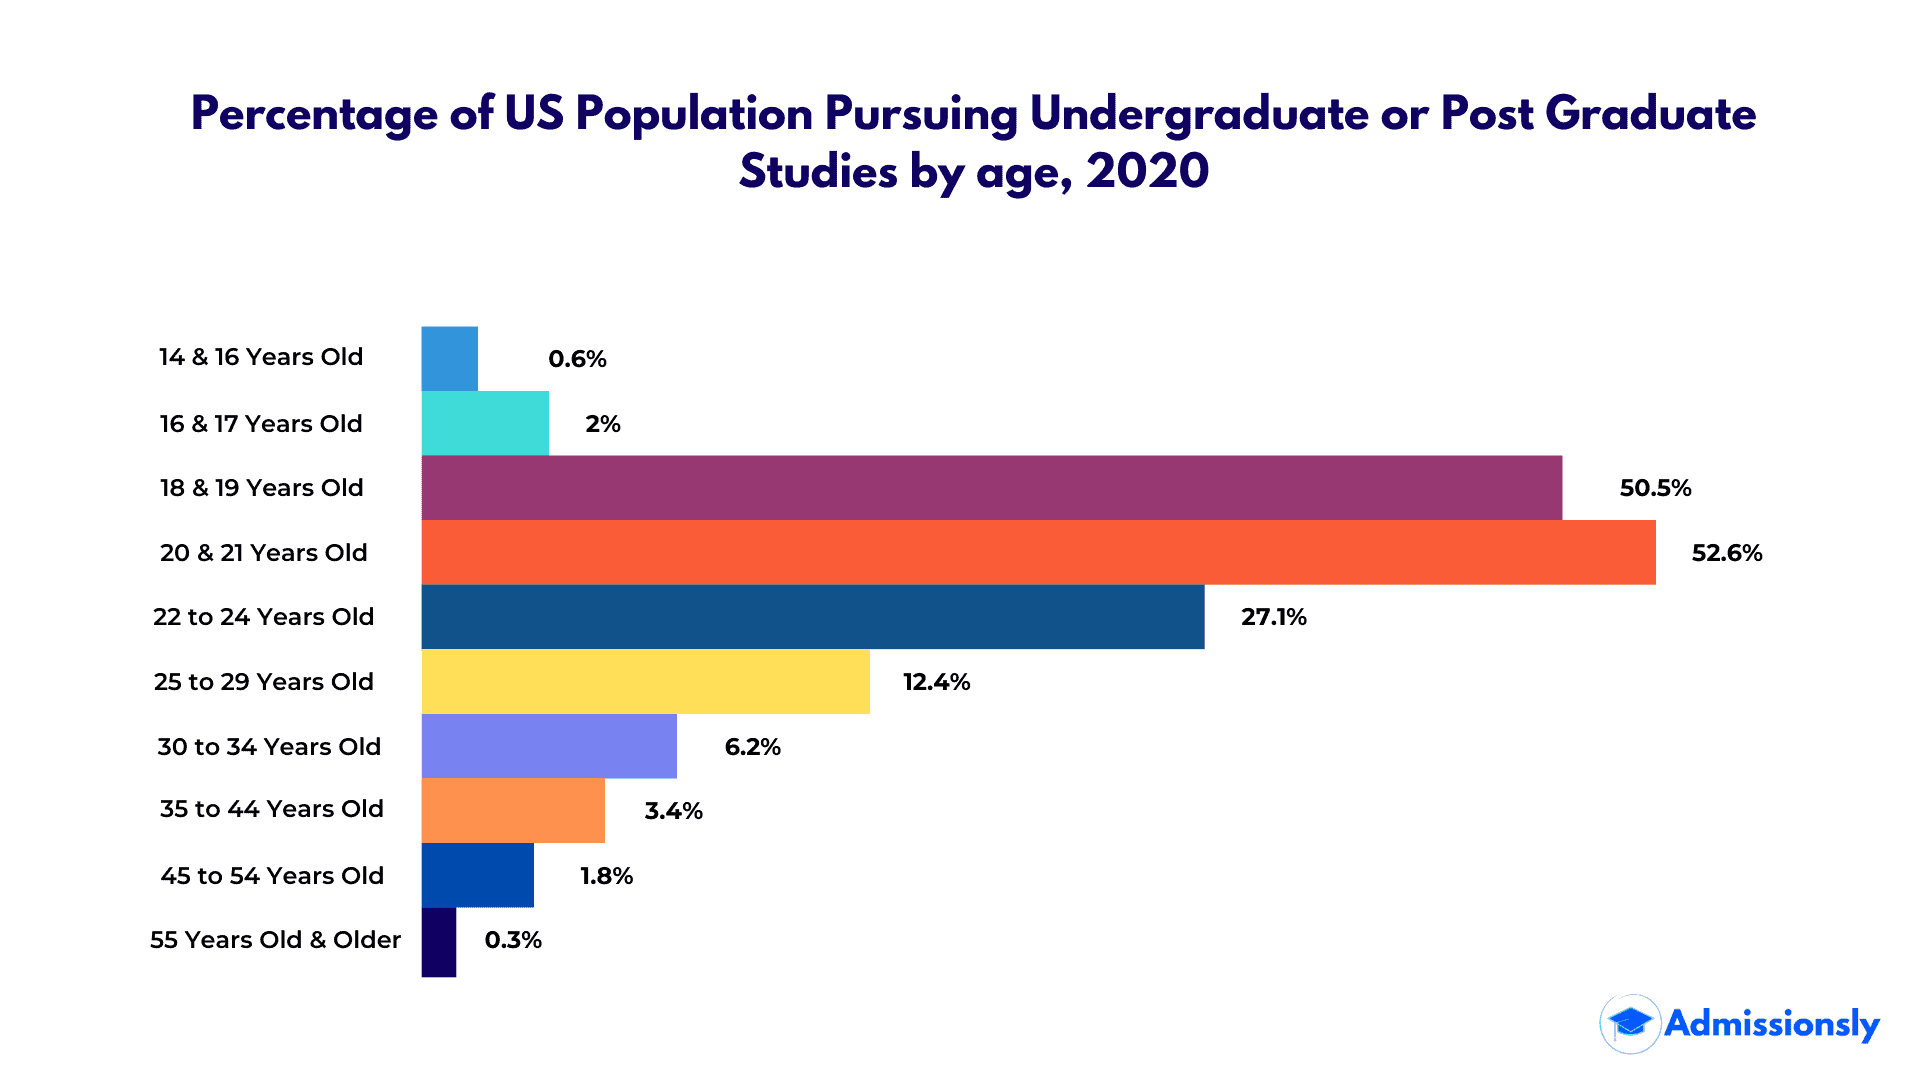
- On average, in 2019 the average age for students enrolled full-time in an undergraduate program was 21.8 years old.
- The best college ranks according to Forbes are Harvard, Stanford, Yale, and Massachusetts Institute of Technology (MIT).
Facts & Stats About American Education
1. Last year, in the United States alone almost 4 million students graduated with a college degree.
In 2019, Education data in their education statistics reports that approximately 3.9 million students have graduated and earned some type of college degree.
According to school facts, most of these students (1.9 million students) got bachelor’s degrees; 989,000 students got associate’s degrees, 820,000 got master’s degrees and 184,000 got doctorate degrees.
Including these numbers, the Education data additionally reports that 35% of the United States population has at least 4 years of college education, which shows incredible progress in the field of education; just for comparison, 79 years ago, in 1940, this number used to be only 4.6% of the population.
The American education statistics show that the number of college graduates keeps on rising each year and this significantly reflects on the job market as well, resulting in more than 46% of the jobs in the USA requiring a college degree.
2. Higher education means higher annual earnings for full-time, year-round millennial workers.
One thing that hasn’t changed in the last 18 years is the fact that higher education means higher annual earnings.
Examination of the annual earnings of 25 to 34 -to year-olds who work full time, done by the National Center for Education Statistics, shows that those with master’s or higher degree had the highest median earnings -$65,000, which is 19% higher than those with bachelor’s degree who earned $54,700.
The value of college degrees is even more obvious from the difference in annual earnings between those with a college degree and those with high school degrees. In fact, it is significantly higher.
Those with bachelor’s degrees have median earnings that are 57% higher than the earnings of those with just a high school degree: in 2018, those with high school degrees earned $34,900, while those with bachelor’s – $54,700.
That being said, it is also important to mention that the median earnings for recent grads (2018) are not higher than those in 2000 or 1990.
3. The unemployment rate is lower among those with college degrees.
While finding a job is hard for everyone, those with no college degree certainly have it harder than those with a college degree of some sort.
The unemployment rate among those with some sort of college degree is lower in comparison with those with less than or with a high school diploma: according to the U.S. Bureau of Labor Statistics, in 2019, the unemployment rate for people age 25 and above for those with less than high school diploma is 5.4%, those with high school diploma is 3.7%, those with associate’s degree is 2.7%, those with Bachelor degree is 2.2%, those with Master’s degree is 2.0%, those with a professional degree is 1.6% and those with a doctoral degree is 1.1%.
The higher the education, the lower the unemployment rates.
4. College graduates are more likely to have full-time jobs, in comparison with high schoolers.
The National Center for Education Statistics in their recent education stats confirms the fact that college graduates are more likely to be employed than high schoolers.
Moreover, statistics on education in the US shows confirm that those with higher education typically are more likely to have full-time jobs in comparison with high schoolers.
The National Center for Education Statistics shows that in 2018, 80% of those with bachelor’s degrees had a full-time job, compared to 72% of those with high school diplomas (or the equivalent of a high school diploma).
5. About 70-80% of college students are active in the labor market while enrolled in college.
The better part of students, (70-80%) are working while following their college lessons according to school statistics done by the College of St. Scholastica; while some of the students have only part-time jobs while in college, others – 40% of undergraduates work full-time or almost full-time (at least 30 hours a week).
Considering the expenses, these job and education facts make a lot of sense since working while getting your education is proven to help students provide for themselves.
Additionally, many of the students claim that this also helps them in lowering their student debts as well as enriching their resumes for future job searches.
Education Stats: Break Down by Demographics
The school demographics differ in the last decades with the percentage of public school students who are white declining from fall 2014 and this trend is also expected to continue through at least fall 2028.
On the other hand, the percentage of students who are Asian, Hispanic, two or more races is expected to increase, while the percentage of black students is expected to be the same. The school demographics for public school students from prekindergarten to 12th grade in 2019 is 50.8 million from which 23.7 million are White students, almost 10 million less – 13.9 are Hispanic, black is 7.7 million, Asian students are 2.7 million, and 2.1 million are of 2 or more races; the other 0.7% are to American Indian/Alaska Native students (0.5%) and Pacific Islander students (0.2%).
When it comes to college enrollment, the demographics differ significantly from the previous statistics. The NCES reports that in 2018, college school demographics were higher for Asian students (59%) compared to 42% who were White, 37% who were Black, and 36% who were Hispanic. All of these refer to 18 to 24 years old students enrolled as undergraduate/graduate students in 2 or 4-year institutions.
On average, in 2019 the average age for students enrolled full-time in an undergraduate program was 21.8 years old.
Education Statistics: by the State
When it comes to education statistics by state, it is really easy to notice that there are significant differences depending on the criteria which you are taking into consideration.
Massachusetts: is the state that ranks the highest for education quality and safety (of public schools); it also holds the highest number of adults with at least a bachelor’s degree and has the nation’s best schools.
Massachusetts also leads in the number of schools in us (high schools), while Texas leads as the state with most colleges;
Iowa: When it comes to graduation rates, Iowa dominates and keeps on increasing their high school graduation rates going up from nearly 1%point from 2013-2014 to 83.2 in 2014-2015 and a record high of 91.4 in 2019.
Florida: When it comes to colleges, Florida takes the lead being home to 3 of the colleges that keep on ranking among the 100 Best Colleges nationally, rank first in the nation for higher education.
The states which are the most populated and have more/better colleges, not surprisingly are also the states that have the four highest student loan debts.; these states are California, Florida, Texas, and New York and they collectively have over 20% of all the student loan borrowers in the states, which in money translates into more than $340 billion of student loan debt.
Which State is Ranked Highest in Education?
When it comes to the highest in education, it depends on which context you are comparing the states. Based on different criteria, this is what the education statistics show about which state is ranked highest in education:
Based on the criteria of which state is the top state for education (the list is created by U.S. News & World Report) Massachusetts ranks as the top state for education followed by New Jersey, Utah.
The national graduation rate is up to almost 88% and based on high school graduation rates Iowa, Kentucky and North Dakota are the states with the highest average high school graduation rates with each graduating an average of 94% of classes in 2018.
The state that ranks highest and first in the nation for the highest education is Florida who is home to the three colleges that rank among the 100 Best Colleges nationally and is followed by Washington, Wyoming, California, and North Dakota.
Which State is the Lowest in Education?
Based on high school graduation rates, Arizona and New Mexico are the two states who each reported graduating an average of 74% of classes in 2018 which makes them the nation’s states with the lowest average graduation rates.
Based on the criteria of which state is the lowest state for education (the list is created by U.S. News & World Report) again Alabama finds its place at the bottom, and right above it is New Mexico and Louisiana. Alabama is also ranked as the state with the worst college programs as well as having the lowest weighted average college graduation of 26.3% of students graduating within 6 years.
Schools and Districts
Private Schools Statistics
- The number of students in the United States enrolled in private schools is 10 times lower than those in public schools.
- According to the Council for American Private Education, in the United States, there are 34,576 private schools that serve 5.7 million PK-12 students which is 10% of all PK-12 students.
- The number of students attending private schools is 5.8 million, while the number of students enrolling in public schools is almost 10 times higher: there are 50.8 million students enrolled in public schools.
- When it comes to private high schools, the private high school graduation rate in 2020 according to Education Data is 0.4 million; in comparison, this same year the public high school graduation rate is 3.3 million.
K-12 Enrollment Statistics
- In the United States, over 56.6 million students were expected to attend school in the fall of 2019; this number included students from all schools (elementary, middle, and high schools) and comprising both public and private schools.
- Each year the average high school population continues to grow. The 2019 fall public school enrolment of 50.8 million schools is slightly higher compared to the 50.7 million enrolled the previous year; similarly, the expectations for elementary and secondary enrollment in the following years, for both public and private schools are expected to keep on increasing in the next 9-10 years, going from 50.8 million from fall 2019 to 51.4 million for fall 2028.
- Of these 50.8 million, most are enrolled in k-8th grade – 35.5 million; second, come high schoolers (9-12th grade) with 15.3 million, then follow the kindergarten with 3.7 million and least are prekindergarten with 1.4 million students.
College Education Statistics
- The best college ranks according to Forbes are Harvard, Stanford, Yale, and Massachusetts Institute of Technology (MIT). This is based on their “30 under 30” criteria; basically, these 4 universities ranked the highest in producing the most members on their “30 under 30” list.
- However, according to many other websites and magazines, including niche, MIT is the best college in America based on rigorous analysis of admissions, financial, and student life data from the U.S. Department of Education along with millions of reviews from students and alumni.
High School Statistics
- The national high school graduation rate from 2019 is 84.6% and this number has increased compared to previous years and is expected to keep on increasing in the future as well.
- According to the U.S. Bureau of Labor Statistics, 66.2% of the high school graduates who were between 16 and 24 age enrolled in college/university in October 2019.
- According to Education data, this year (2019-2020), it is projected that 3.6 million students will graduate with high school diplomas; from them, 3.3 million will graduate from public schools while 347,000 will graduate from private schools.
- Statistics on education in the US show that those students who are from higher-income high schools are 25% more likely to enroll in college right after they finish high school (69%) compared to those from low-income schools (55%).
What is the Average Public School Size?
The Public School review reports that the US national average public school size in 2020 is approximately 526 students; the state that has the largest average public school student size is Georgia with approximately 769 students, while the smallest is considered Montana with only 179 students.
However, there is one county that separates from others based on the largest average public school student size; this county with 1309 students in Gwinnett County.
In comparison with the public school size, the national average private school student size is much smaller, with approximately 175 students. Louisiana with 310 and Hawaii with 302 students are the two states with the largest average private school student size.
And based on counties, Orange County, NY with 461 students is considered to be the county with the largest average private school student size.
All About Students in the United States
- In 2018 there were 14.53 million students in the USA who were enrolled in public schools and 5.12 million in private colleges. These numbers are expected to increase to 14.89 million and 5.22 million by 2029.
- In 2019, as expected, the number of students kept increasing, so about 19.9 million students enrolled in colleges and universities, from which 14.7 million were in public institutions while 5.2 in private institutions. That being said, this number is still lower (about 5%) than the peak of student enrollment in the fall of 2010 when this number was 21 million.
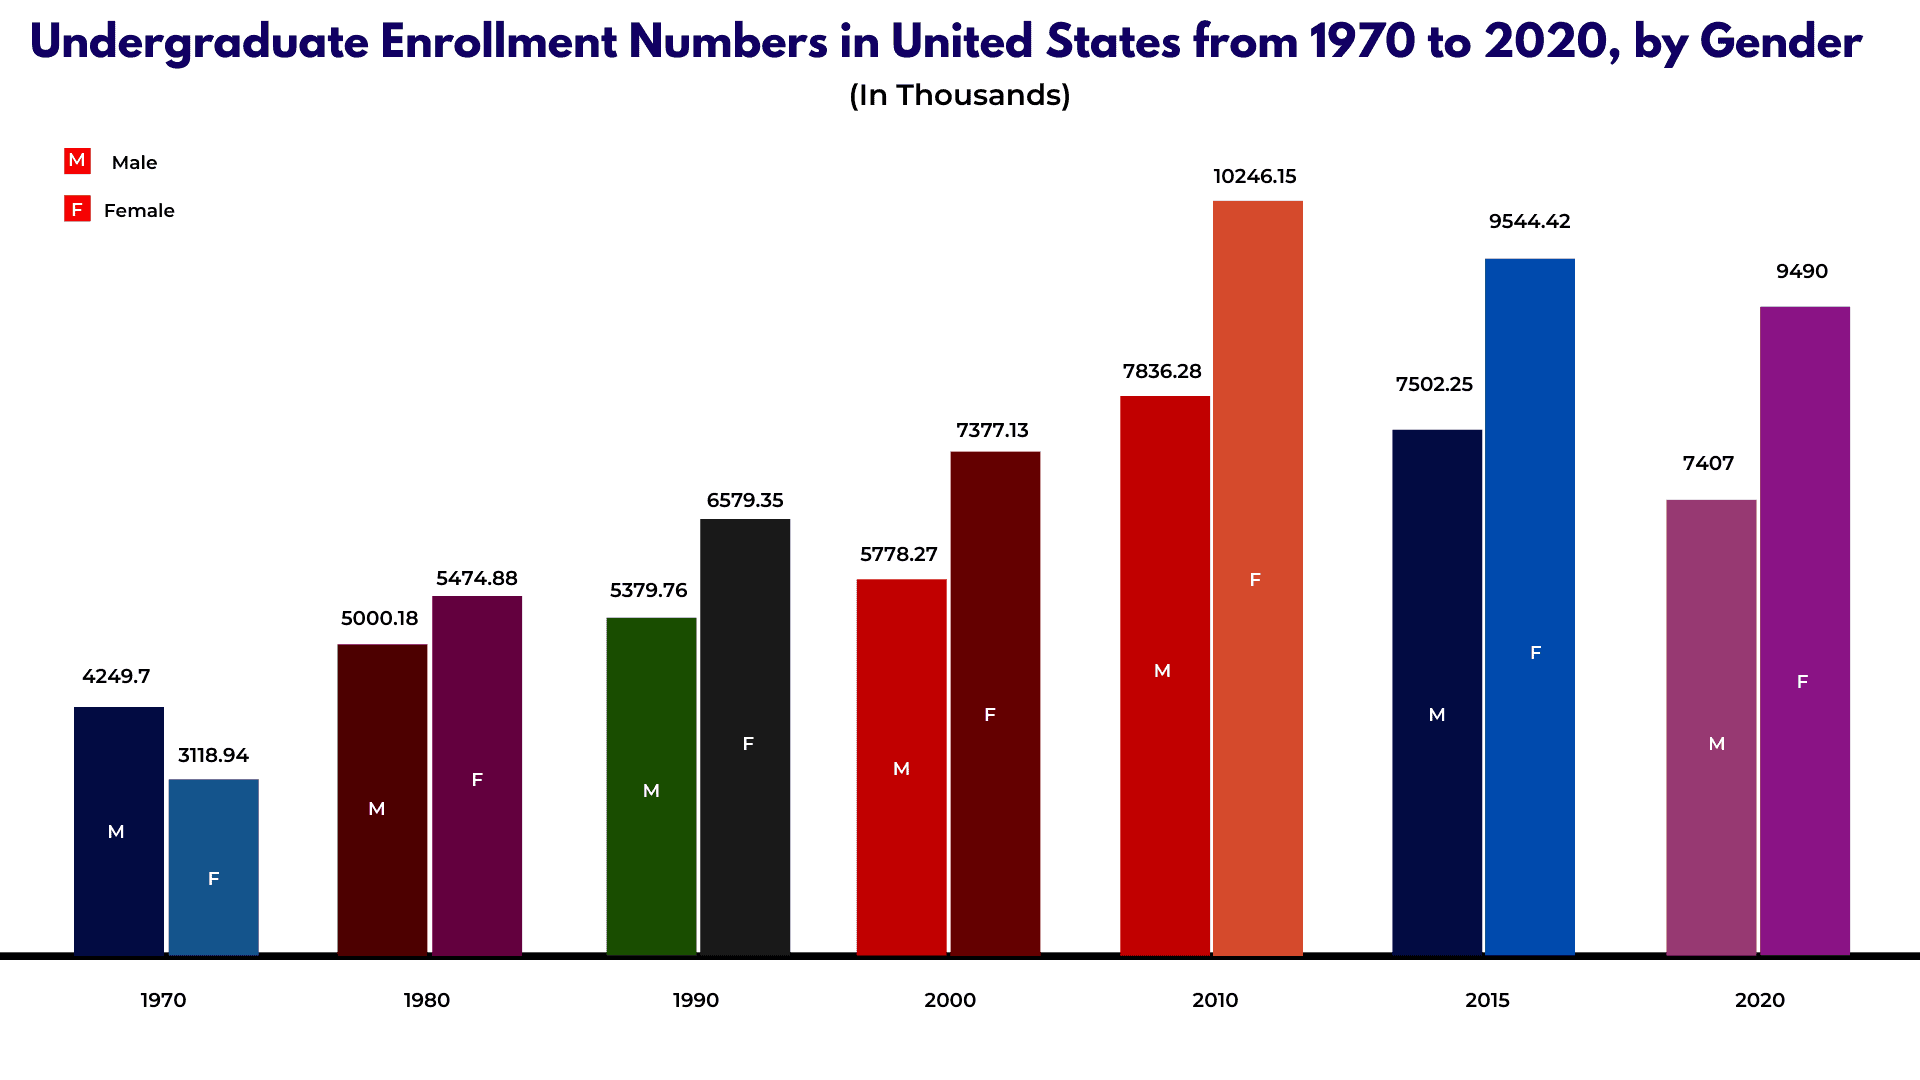
- Most students of fall 2019 are female – 11.3 million, while males are 8.6 million.
- In 2019, 54% of college students took debt (which includes student loans) to cover their education. The average amount of student loan debt per borrower was $35,359.
- It is estimated that roughly 14.4% of adults have some sort of student loan.
- In America, in the public colleges, this past year, around 40% of the full-time students live on campus and the same percent – 40% live in off-campus housing, and only 20% live with their parents. In private colleges, this number differs with 64% of the full-time students living on campus, 19% in off-campus housing, and only 17% with their parents.
What Percentage of Students Go to College?
Interestingly enough, statistics on education in the US done by Education Data show that Americans are becoming more skeptical as to whether or not college education prepares young adults for future life and workforce which reflects in the percentage of students going to college.
In the last school year, in fall 2019, approximately 18.2 million students who graduated enrolled in colleges and universities. From them, the education statistics show that 7.9 million enrolled in public 4-year institutions, another 3.8 million chose to enroll in private non-profit 4-year institutions, and 750,000 enrolled in private, for-profit 4-year institutions.
When it comes to college graduation, the US ranks 19th in college graduation rates, with approximately 3.9 million students graduating from college in the US in 2019.
How Much Do Students Spend on Education?
In the last 5 years (between 2014-2015 and 2019-2020) the tuition and fees rose the most among other items in student budgets at private nonprofit 4-year institutions.
The National Association of College Stores reports that in 2018-2019 students were spending on average $415 in course materials, $419 on technology, and $108 on supplies. They also report that 39% 39% of the total budget for in-state students living on campus at public four-year institutions and 20% of the budget for public two-year college students who pay for off-campus housing are reserved for tuition and fees.
The latest education statistics showed that in America there are 44.7 million student borrowers who collectively owe more than $1.5 trillion in student loan debt. The student loan default rate is 11.4%. Two of the most used and popular types of student loan forgiveness that students in America use are Public Service Loan Forgiveness and Teacher Student Loan Forgiveness.
Teachers & Principle Statistics
How Many Teachers Are There in the U.S.?
According to the National Center for Education Statistics, in the U.S. in the fall of 2019, the number of teachers in the US is 3.7 million; from them, only 0.5 million are teaching in private schools, while the rest, 3.2 million in public schools. This makes the national average student-teacher ratio in public schools to be 16 to 1.
Although the teacher’s force is still predominately white and female, there was a small, yet not significant enough change in the teacher’s demographics in the last few years. Based on the only statistics we found from 2018 that speak about 2016, from 84% in 1999-2000 the number of white female public school teachers declined to 80%. The black teacher rates also dropped from 9% to 7% whiles the Hispanic increased from 6 to 9%. Of the other 3%, 2 % were Asian while 1% were of 2 or more races. This same year, on average public school teachers, had 14 years of experience and working hours of roughly 53 hours a week.
How Many Principles Are There?
In the United States in 2017-2018 were employed almost 90.900 principles in the public schools, which is about 8% higher in comparison with 1999-2000;
Also, the percentage of female principals in this year was 10% higher (54% of the total number) in comparison with 1999-2000 (44%).
Regarding demographics, most principles of public schools, 78% are white, (which is lower than the 82% from 1999-2000) 11% – Black, 9% -Hispanic, 1% Pacific Islanders, and 1% of Two or more races, Asian, and American Indian/Alaska Native.
Of most of them, 68% were elementary school principals, 22% secondary, and 9 % combined. Of them, most had a master’s degree – 62%, 26% were with an education specialist degree, and 11 percent had a doctor’s or first-professional degree.
Technology in Education
- Technology became a vital part of the 21st-century classroom especially due to the current situation.
- Based on recent research done by Cambridge International, in which participated 20000 students and teachers (12-19 years old) from 100 countries, the usage of technology in the classrooms continues to grow rapidly.
- Based on this, 48% of students use desktop computers during their lessons, 42% use smartphones, 33% interactive whiteboards, and 20% tablets.
- In the United States smartphones are used in 74% of the classrooms while worldwide in 2018 this number was 55%.
- Students are also using technology when working on their studies from home, with 64% of students using smartphones and 65% (in U.S. 85%) using a notebook computer to do their homework. Relying on technology helps students gain more knowledge and have easier access to information at any time.
Federal Funds for Education
The average per-student expenditure in public schools (including both elementary and secondary) is $13,440. This statistic refers to PK-12 education for this year and the final number is $680 billion.
When it comes to education, both state and local play a significant role in education funding; the US Department of Education reports that the federal government contributes about 8% to funding US public schools.
Covid-19 Impacts Education System
More than 1.37 billion students which are representing 3 out of 4 children and youth worldwide in 138 countries around the world, including the US are home due to the ongoing pandemic, reports UNESCO.
On the territory of the U.S., the governors and legislatures decided to call for the statewide closure of at least 124,000 public schools in 48 states in order to help prevent spreading the Covid-19.
Considering the constant changes that come during the epidemic, different Departments are bringing out new measures to help students:
- USDA brought up proactive flexibility to allow meal services while the epidemic lasts and schools are closed;
- ED also informed that they were considering and later on accepted to grant a waiver to any state that due to the current situation is unable to assess its students, providing relief from federally mandated testing requirements for this school year. The following month, ED spread these waivers for all 50 states, Washington, D.C., Puerto Rico, and the Bureau of Indian Education.
- CDC came with guidance for school settings and it includes instructions about how the educational system and other programs such as summer camps, child care programs, youth sports, etc. are supposed to function when they open.
- Due to the COVID-19 pandemic, worldwide (including the U.S.) 60.2 million teachers are no longer in the classrooms.