
College enrollment statistics quantify the number of students attending postsecondary institutions in the United States. These data points typically include total enrollment figures, demographic breakdowns by age, gender, race, and institutional type (public, private, undergraduate, graduate). By tracking these metrics over time, researchers and policymakers can gauge patterns in higher education participation, identify emerging trends, and evaluate the impact of socioeconomic factors on college attendance.
This article integrates data from leading sources, including the National Center for Education Statistics (NCES), National Student Clearinghouse (NSC) Research Center and other. Wherever possible, we use the most recent Fall 2023 and 2024 data to provide clarity on current patterns. By combining these authoritative sources, we deliver a comprehensive analysis to guide prospective students, administrators, and policymakers.
Key College Enrollment Statistics
- In spring 2025, the number of undergraduate students reached 15.3 million.
- In fall 2023, there were approximately 19.43 million students enrolled in U.S. postsecondary institutions including 15.2 million at the undergraduate level and 4.2 million at the graduate level.
- The share of adult learners (25+) has increased to 32.3%, reflecting demand for flexible, career-oriented programs.
- Female students now make up 57.7% of the student body, while male representation is slowly increasing.
- Enrollment growth is strongest in STEM disciplines (Engineering +5.8%, CS +7.2%) and graduate programs (+4.1%).
- Community colleges saw a 3.6% surge, driven by affordability initiatives.
- Online enrollment reached 4.7 million (24.2%), with hybrid models bridging gaps between on-campus and remote learners.
- In October 2024, 62.8% of high school graduates were enrolled in college, a slight increase from 61.4% in fall 2023.
Overview of National Enrollment Trends
In Fall 2023, total postsecondary enrollment reached approximately 19.43 million students, up from 19.01 million in Fall 2022—an increase of 2.2%. This rebound reflects recovery from pandemic-related declines in 2020–2021 when enrollment dipped by nearly 5%. Between 2018 and 2023, undergraduate enrollment held near 15.2 million, while graduate enrollment grew from 3.5 million to 4.2 million.
Key drivers for the recent enrollment increase include:
- Post-Pandemic Rebound: As campuses fully reopened in 2022 and 2023, applications and matriculation rates recovered, especially at community colleges.
- Online and Hybrid Program Expansion: Institutions invested in scalable online offerings, attracting non-traditional and working adult learners.
- Economic Incentives: Rising tuition costs incentivized students to stay local or enroll in two-year institutions. Federal stimulus and renewed financial aid packages in 2023 improved affordability.
The COVID-19 pandemic disrupted enrollment in 2020 and 2021. Key impacts included:
- Undergraduate Decline: Undergraduate enrollment dropped by 4.8% between Fall 2019 and Fall 2021. Many high-school graduates delayed enrollment or opted for gap years.
- Adult Learner Fluctuations: Working adults (ages 25–39) saw a 6% enrollment decrease in 2020 but rebounded sharply in 2022 as online options increased.
- Institutional Budget Shortfalls: Reduced enrollment at private institutions spurred temporary hiring freezes and shifts toward virtual instruction to retain students.
College Enrollment Statistics by Demographic Factors
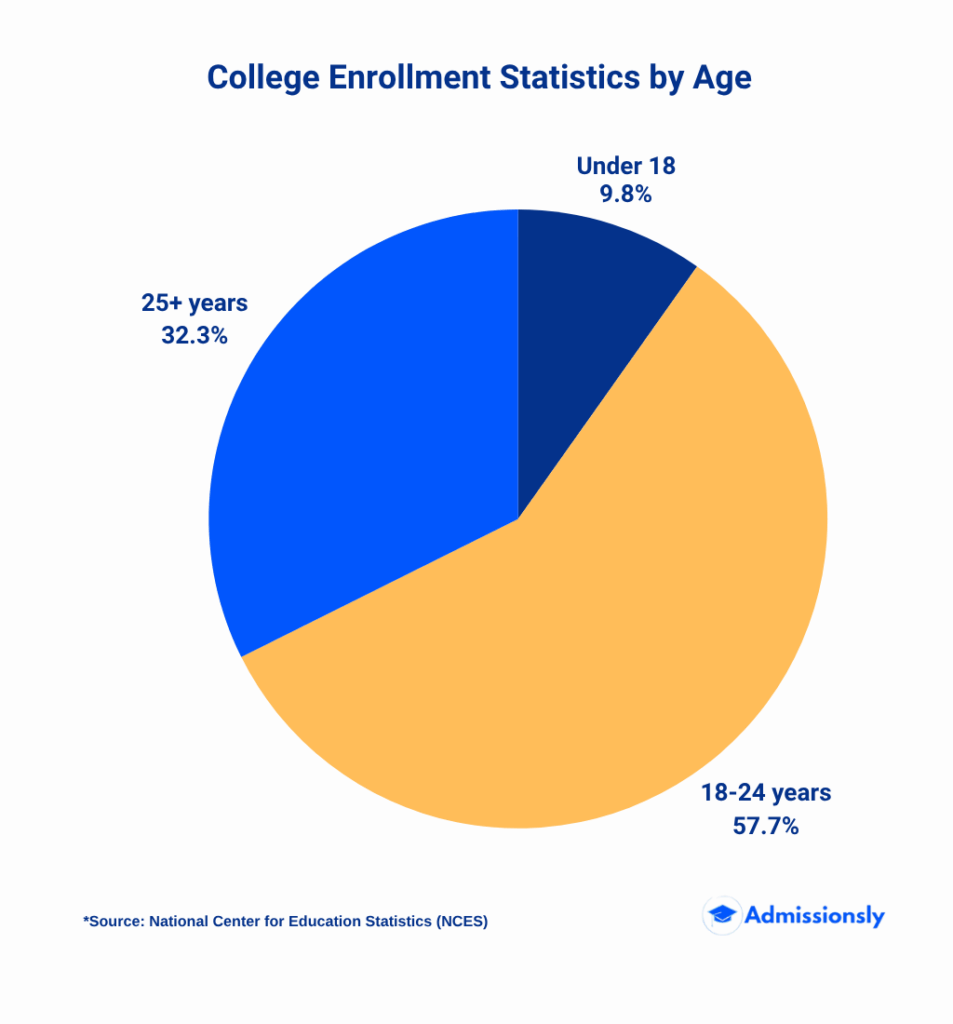
College Enrollment by Age
Using Fall 2023 NCES data, enrollment by age category was:
| Age Group | College Enrollment (millions) | Percentage of Total (%) |
| Under 18 | 1.91 | 9.8 |
| 18–19 | 4.46 | 22.9 |
| 20–21 | 3.87 | 19.9 |
| 22–24 | 2.89 | 14.9 |
| 25–29 | 2.36 | 12.1 |
| 30–34 | 1.37 | 7.1 |
| 35–39 | 0.90 | 4.6 |
| 40–49 | 1.06 | 5.4 |
| 50–64 | 0.51 | 2.6 |
| 65+ | 0.07 | 0.4 |
Traditional college-age students (18–24 years) still comprise 57.7% of total enrollment, while learners aged 25 and older make up 32.3%. This shift toward non-traditional students reflects growing demand for flexible schedules, online courses, and career-focused programs that accommodate working adults and lifelong learners. Institutions with evening classes, weekend workshops, and comprehensive online support report stronger retention among students over age 30.
High School Graduate College Enrollment Statistics: In October 2024, 62.8% of high school graduates enrolled in college, representing a slight increase from 61.4% in Fall 2023. This immediate college enrollment rate for high school graduates highlights sustained demand despite economic challenges.
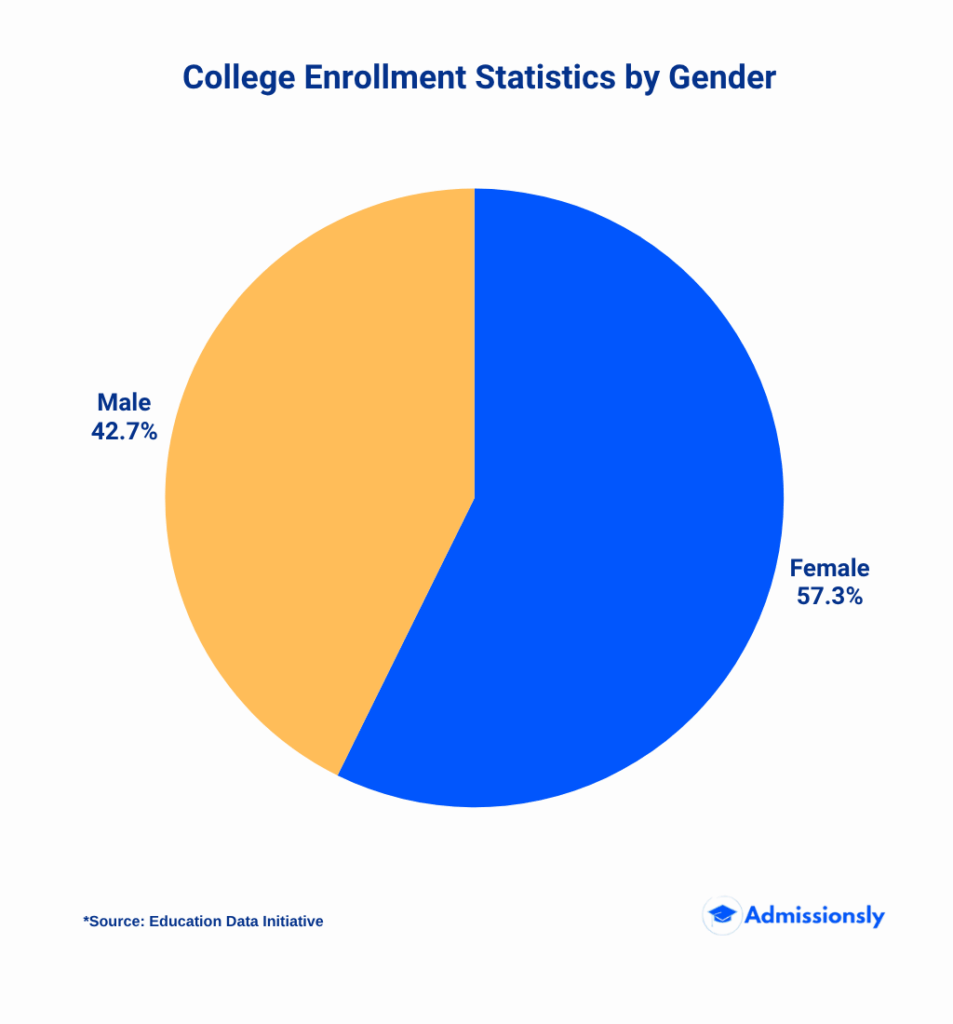
College Enrollment by Gender
| Gender | College Enrollment (millions) | Percentage of Total (%) |
| Female | 11.2 | 57.7 |
| Male | 8.2 | 42.3 |
Over the past decade, female college enrollment in the USA rose from 54.1% in 2013 to 57.7% in 2023, while male participation dropped from 45.9% to 42.3%, underscoring growing gender disparity trends in higher education.
College Enrollment by Race and and Ethnicity
| Race/Ethnicity | Enrollment (millions) | Percentage of Total (%) |
| White | 10.1 | 52.0 |
| Hispanic/Latino | 3.8 | 19.6 |
| Black/African American | 2.3 | 11.8 |
| Asian | 1.3 | 6.7 |
| Other (Native American, Two or More Races, International) | 2.0 | 10.0 |
The table above illustrates college enrollment by race: White students lead at 52.0% (10.1M), followed by Hispanic/Latino at 19.6% (3.8M), and Black/African American at 11.8% (2.3M). Asian students account for 6.7% (1.3M), while Native American, multiracial, and international enrollees combine for 10.0% (2.0M). This breakdown of postsecondary education demographics underscores a growing diversity trend, with minority groups representing 48.0% of total enrollment in the USA. Educational institutions can use these insights to develop targeted outreach and support programs that address the needs of a diverse student population.
Hispanic enrollment rose 4.4% from Fall 2022 to Fall 2023, reflecting demographic shifts in high-school graduates. Black student enrollment grew 2.8% during the same period, while Asian enrollment was up 3.1% year-over-year.
International Students College Enrollment
In Fall 2023, approximately 1.1 million international students comprised 5.7% of total enrollment—up from 5.2% in 2022. Recovery from pandemic-related travel restrictions drove growth, especially at research institutions in California and New York.
Top source countries for international student enrollment in Fall 2023 include China (31%), India (24%), South Korea (7%), Saudi Arabia (4%), and Canada (3%). International undergraduate enrollment trends indicate a preference for STEM and business majors, whereas international graduate students frequently pursue programs in engineering, computer science, and health sciences.
College Enrollment Statistics by Institution Type
Public vs. Private Institutions
In the 2022–2023 school year, the number of students in public four-year colleges reached 7.18 million, while the number of students in private four-year colleges was less than half that, at 3.38 million. Community college enrollment reached 8.55 million, accounting for 40.4 percent of total undergraduate enrollment. These college enrollment trends highlight growing demand for affordable, accessible education options in the United States, particularly in public universities and community colleges.
| Institution Type | Enrollment (millions) | Percentage of Total (%) |
| Community Colleges | 8,551,932 | 40.4 |
| Public four-years | 7,182,226 | 34.0 |
| Private nonprofit four-year | 3,377,934 | 16.0 |
| Private for-profit | 1,730,714 | 8.2 |
| Other public two-years, less-than-two-years | 222,843 | 1.1 |
| Other private not-for-profits | 79,790 | 0.4 |
Research Universities vs. Liberal Arts Colleges
The top 100 research universities collectively enrolled 3.5 million undergraduates and 1.2 million graduates in Fall 2023. Between Fall 2018 and Fall 2023, these institutions increased graduate enrollment by 7%, particularly in STEM fields. During that same period, undergraduate enrollment at flagship state research campuses grew by 2% annually, reflecting sustained demand for research-driven programs.
Liberal arts colleges experienced modest declines of –0.8% in Fall 2021, –2.5% in Fall 2022, and –1.2% in Fall 2023 but have begun offering interdisciplinary and professional pathways to remain competitive. Specialized institutions—such as art, music, and technical colleges—grew 2.1% in Fall 2023, signaling robust and accelerating interest in niche, career-focused curricula.
College Enrollment Statistics by Program and Discipline
STEM vs. Non-STEM Fields
| Discipline | Enrollment in Fall 2023 (millions) | Year-Over-Year Change (Fall 2022 to Fall 2023) (%) |
| Engineering | 1.12 | 5.8% |
| Computer Science | 0.94 | 7.2% |
| Business | 3.2 | 3.4% |
| Social Sciences & Humanities | 2.4 | 0.0% |
For Fall 2023, engineering enrollment was 1.12 million (5.8% YoY growth), computer science reached 0.94 million (7.2% YoY), and business hit 3.2 million (3.4% YoY). Liberal Arts & Humanities and Social Sciences each held steady at 2.4 million (0% change).
STEM majors represent 27% of total enrollment, driven by high-paying job prospects and national funding initiatives targeting artificial intelligence, cybersecurity, and biotechnology.
While business remains the largest discipline by enrollment, liberal arts programs are repositioning curricula to include data analytics and digital humanities to attract a broader student base.
Graduate vs. Undergraduate Enrollment
Graduate enrollment hit 4.2 million in Fall 2023, a 4.1% increase from 2022. Master’s programs grew by 3.6%, while doctoral enrollment grew by 5.2%. Fields such as public health, education leadership, and data science saw the largest increases, reflecting labor market demands for advanced specialization.
Undergraduate enrollment totaled 15.2 million, up 1.8% from Fall 2022. Retention rates for first-time undergraduates improved to 79.5% (Fall 2023 cohort) due to enhanced academic support services, early alert systems, and tutoring programs.
College Enrollment Statistics by State
Top 5 States by Total Enrollment
| State | Enrollment (millions) | Percentage of Total (%) |
| California | 2.9 | 14.9 |
| Texas | 2.4 | 12.3 |
| New York | 1.8 | 9.3 |
| Florida | 1.5 | 7.7 |
| Pennsylvania | 1.2 | 6.2 |
The table above highlights the top five states by college enrollment for Fall 2023. California leads with 2.9 million students (14.9% of national enrollment), followed by Texas at 2.4 million (12.3%), New York at 1.8 million (9.3%), Florida at 1.5 million (7.7%), and Pennsylvania at 1.2 million (6.2%). These five states collectively enroll over 50% of all U.S. college students, reflecting where demand for higher education is strongest in the USA. Colleges can leverage these insights to tailor recruitment strategies and resource allocation across major enrollment hubs.
For Fall 2023, the District of Columbia led per-capita college enrollment at 22.5%, followed by Massachusetts at 19.8%, Colorado at 17.6%, Virginia at 17.2%, and New Jersey at 16.9%. These enrollment density figures demonstrate where higher education demand is most concentrated, highlighting regions with robust university systems and strong student populations.
Urban campuses—particularly those in metropolitan areas like New York City, Chicago, and Los Angeles—saw a 4.5% enrollment increase in Fall 2023. Easy access to internships and diversified economies drives urban student appeal.
Rural college enrollment declined by 1.3% in 2023, exacerbated by population declines and limited broadband access. However, initiatives like expanded online infrastructure and workforce training grants aim to reverse these trends by offering localized career pathways.
Online vs. On-Campus College Enrollment Statistics
Online enrollment accounted for 4.7 million students (24.2% of total) in Fall 2023—up from 3.5 million (18.4%) in 2019. Hybrid programs (combining online lectures with on-campus labs) grew 6.1%, reflecting institutional investments in flexible learning models.
Leading providers include Arizona State University, University of Florida, Southern New Hampshire University, and Purdue University Global. These institutions report online retention rates near 75%, demonstrating that quality online programs can match campus-based experiences.
According to the 2023 National Survey of Student Engagement (NSSE), 68% of online learners report satisfaction with program flexibility, while 45% cite concerns about limited peer interaction. Institutions address these gaps via virtual clubs, synchronous sessions, and robust student support platforms.
On-campus first‐year retention stands at 81.2%, compared with 64.5% for online programs, indicating that students who begin their studies on campus are significantly more likely to continue into their second year. Similarly, the six‐year graduation rate for on‐campus learners is 63.8%, while online students graduate at a rate of 50.4% over the same period. These figures highlight a persistent gap between on‐campus and online outcomes, underscoring the importance of targeted support services and engagement strategies to improve retention and completion for remote learners.
Factors Influencing Enrollment Trends
Economic Conditions and Tuition Costs
Impact of Rising Tuition Fees on Enrollment Decisions
Average tuition and fees at public four-year institutions reached $10,560 for in-state students and $27,020 for out-of-state in 2023. At private four-year colleges, the average was $37,650. High costs have driven more students toward community colleges and workforce certificates, especially when paired with federal Pell Grants.
Financial Aid Availability and Student Debt Concerns
In 2023, 68% of undergraduates received some form of financial aid, with average indebtedness per graduate at $28,950. The rising debt burden has prompted policy discussions on debt forgiveness, expanded grant programs, and income-driven repayment plans.
Labor Market Demands
Demand for Skilled Graduates in Emerging Industries
High-growth sectors—such as artificial intelligence, renewable energy, and biotechnology—drove a 7.9% increase in STEM program enrollment. Employers’ demand for data analysts and cybersecurity experts amplified growth in related master’s and certificate programs.
Role of Career-Oriented Programs in Enrollment Choices
Institutions offering co-op and internship-integrated curricula report 12% higher enrollment in 2023. Career services partnerships with local industries have become a key recruitment tool, linking enrollment decisions to post-graduation job placement rates.
Policy and Regulatory Changes
Federal and State Education Policies Affecting Enrollment
- Free Community College Initiatives: Several states (e.g., New York, Tennessee, Oregon) expanded free tuition programs for two-year institutions, boosting community college enrollment by 4.2% in 2023.
- Title IX and Civility Policies: Inclusive campus climates and anti-discrimination measures have improved retention for minority and LGBTQ+ students.
Implications of Immigration and Visa Regulations on International Students
In 2023, tightening visa scrutiny temporarily slowed new international enrollments early in the academic year, but institutions offering expedited support services reversed the decline by Fall 2023. H-1B policy shifts and post-graduation work opportunities continue to influence international student decisions.
Future Projections and Enrollment Forecasts
Enrollment Projections Through 2030
Projections combine historical NCES data, demographic shifts (i.e., U.S. population of 18–24-year-olds), and macroeconomic indicators. A cohort-survival model anticipates annual changes in high-school graduate counts, while economic forecasts gauge affordability.
- Total Enrollment: Projected to reach 20.1 million by Fall 2028 (+3.4% from 2023)
- Graduate Enrollment: Expected to grow to 4.6 million by 2030 (+9.5%) as demand for specialized skills rises.
- Adult Learners (25+): Anticipate to comprise 35% of total enrollment by 2030, fueled by upskilling and reskilling in a changing labor market.
Potential Disruptors in Higher Education
Technological Innovations (AI Tutoring, Virtual Classrooms)
AI-driven tutoring platforms and immersive virtual reality (VR) classrooms are predicted to enhance student engagement and lower operational costs. By 2030, an estimated 15% of courses will include AI-powered adaptive learning modules, improving retention by up to 10% for at-risk students.
Societal and Economic Shifts Influencing Future Enrollment
- Gig Economy Growth: As more graduates pursue freelance and contract work, micro-credential programs may attract 1.2 million learners by 2030.
- Aging Population: Increased demand for lifelong learning among adults aged 50+ could add 0.3 million enrollees in continuing education programs by 2028.
Conclusion
Fall 2023 data show total postsecondary enrollment at 19.43 million—nearing pre‑pandemic levels—with adult learners (ages 25+) making up 32.3% of students and female enrollment rising to 57.7% versus 42.3% male, while STEM fields (engineering +5.8%, computer science +7.2%) and graduate programs (+4.1%) led growth; community colleges surged 3.6% and online learning accounted for 24.2% of enrollees (4.7 million). These trends highlight a shift toward flexible, career‑focused education, prompting prospective students to seek programs with strong career services, institutions to invest in digital infrastructure and targeted support, and policymakers to expand grants and align curricula with workforce needs. To navigate this evolving landscape, stakeholders should enhance online/hybrid offerings, strengthen industry partnerships, promote diversity initiatives, and adjust funding strategies in response to economic indicators.
Frequently Asked Questions (FAQs)
What Is the Current College Enrollment Rate in the USA?
As of Fall 2023, approximately 19.43 million students are enrolled in postsecondary institutions, representing a 2.2% increase over the previous year and signifying near-full recovery from pandemic declines.
Which Age Group Has the Highest Enrollment?
Students aged 18–19 comprise the largest age cohort at 22.9% (4.46 million), followed by ages 20–21 at 19.9%. Adult learners (ages 25+) collectively account for 32.3% of enrollment.
How Has the Pandemic Impacted College Enrollment?
The pandemic caused a 4.8% decline in undergraduate enrollment between Fall 2019 and Fall 2021. Since then, a combination of online program expansion, financial aid packages, and campus reopenings has driven a 2.2% year-over-year rebound to 19.43 million in Fall 2023.
Are More Students Choosing Online Programs?
Yes—4.7 million students (24.2% of total) enrolled in fully online programs in Fall 2023, up from 18.4% in 2019. Hybrid program enrollment also rose by 6.1%, demonstrating sustained interest in flexible learning models.
What Are the Top Fields of Study in Demand?
Engineering and Computer Science lead all majors, with year-over-year enrollment growth of 5.8% and 7.2%, respectively. Business remains the largest discipline at 16.5% of total enrollment. Graduate programs in Data Science, Public Health, and Education Leadership also saw significant increases.
References and Data Sources
- National Center for Education Statistics (NCES): Enrollment data by age, gender, race, and institution type (Fall 2023).
- EducationData.org: Comprehensive enrollment trend analysis and forecasts.
- National Student Clearinghouse (NSC) Research Center: Current-term enrollment estimates (Fall 2023).
- Integrated Postsecondary Education Data System (IPEDS): Detailed institutional reports on online vs. on-campus enrollment.
- Industry Reports (2023–2024): Labor market analyses and higher education forecasts.